The teaching and learning materials presented here were developed to complement the content of the Guideline Evidence-Based Health Information and are designed to promote health literacy. These resources aim to support individuals in understanding, critically evaluating, applying, and creating evidence-based health information. The materials are highly versatile and cater to a wide range of audiences in education, professional practice, and training. Their purpose is to improve access to reliable knowledge and empower people to informed decisions in health-related matters.
RiskTool
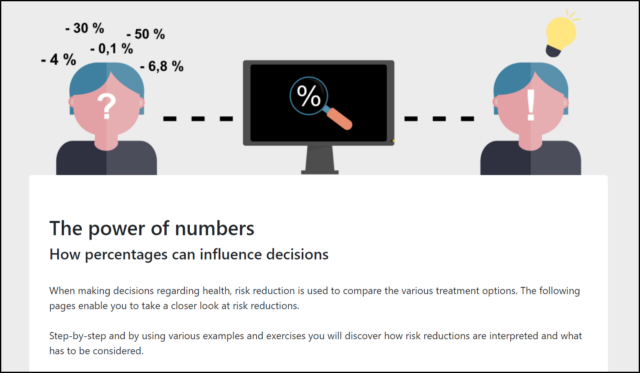
New headlines on health topics appear daily, but their meaning and scientific basis are often unclear. This 15-minute online learning module shows how the presentation of such headlines can influence decisions and supports the interpretation of risk reductions.
Target group: People with an interest in health topics and healthcare professionals
Contents: Interpretation and calculation of absolute and relative risk reduction and baseline risk